DE
DE
 EN
EN
 ES
ES
 FR
FR
Release Notes RAPTOR SERVER v1.23

The template now provides three filtering sections to control the order and visibility of results.
Access: From the menu icon (upper right), open Tenant Admin ➡️ Manage report templates.
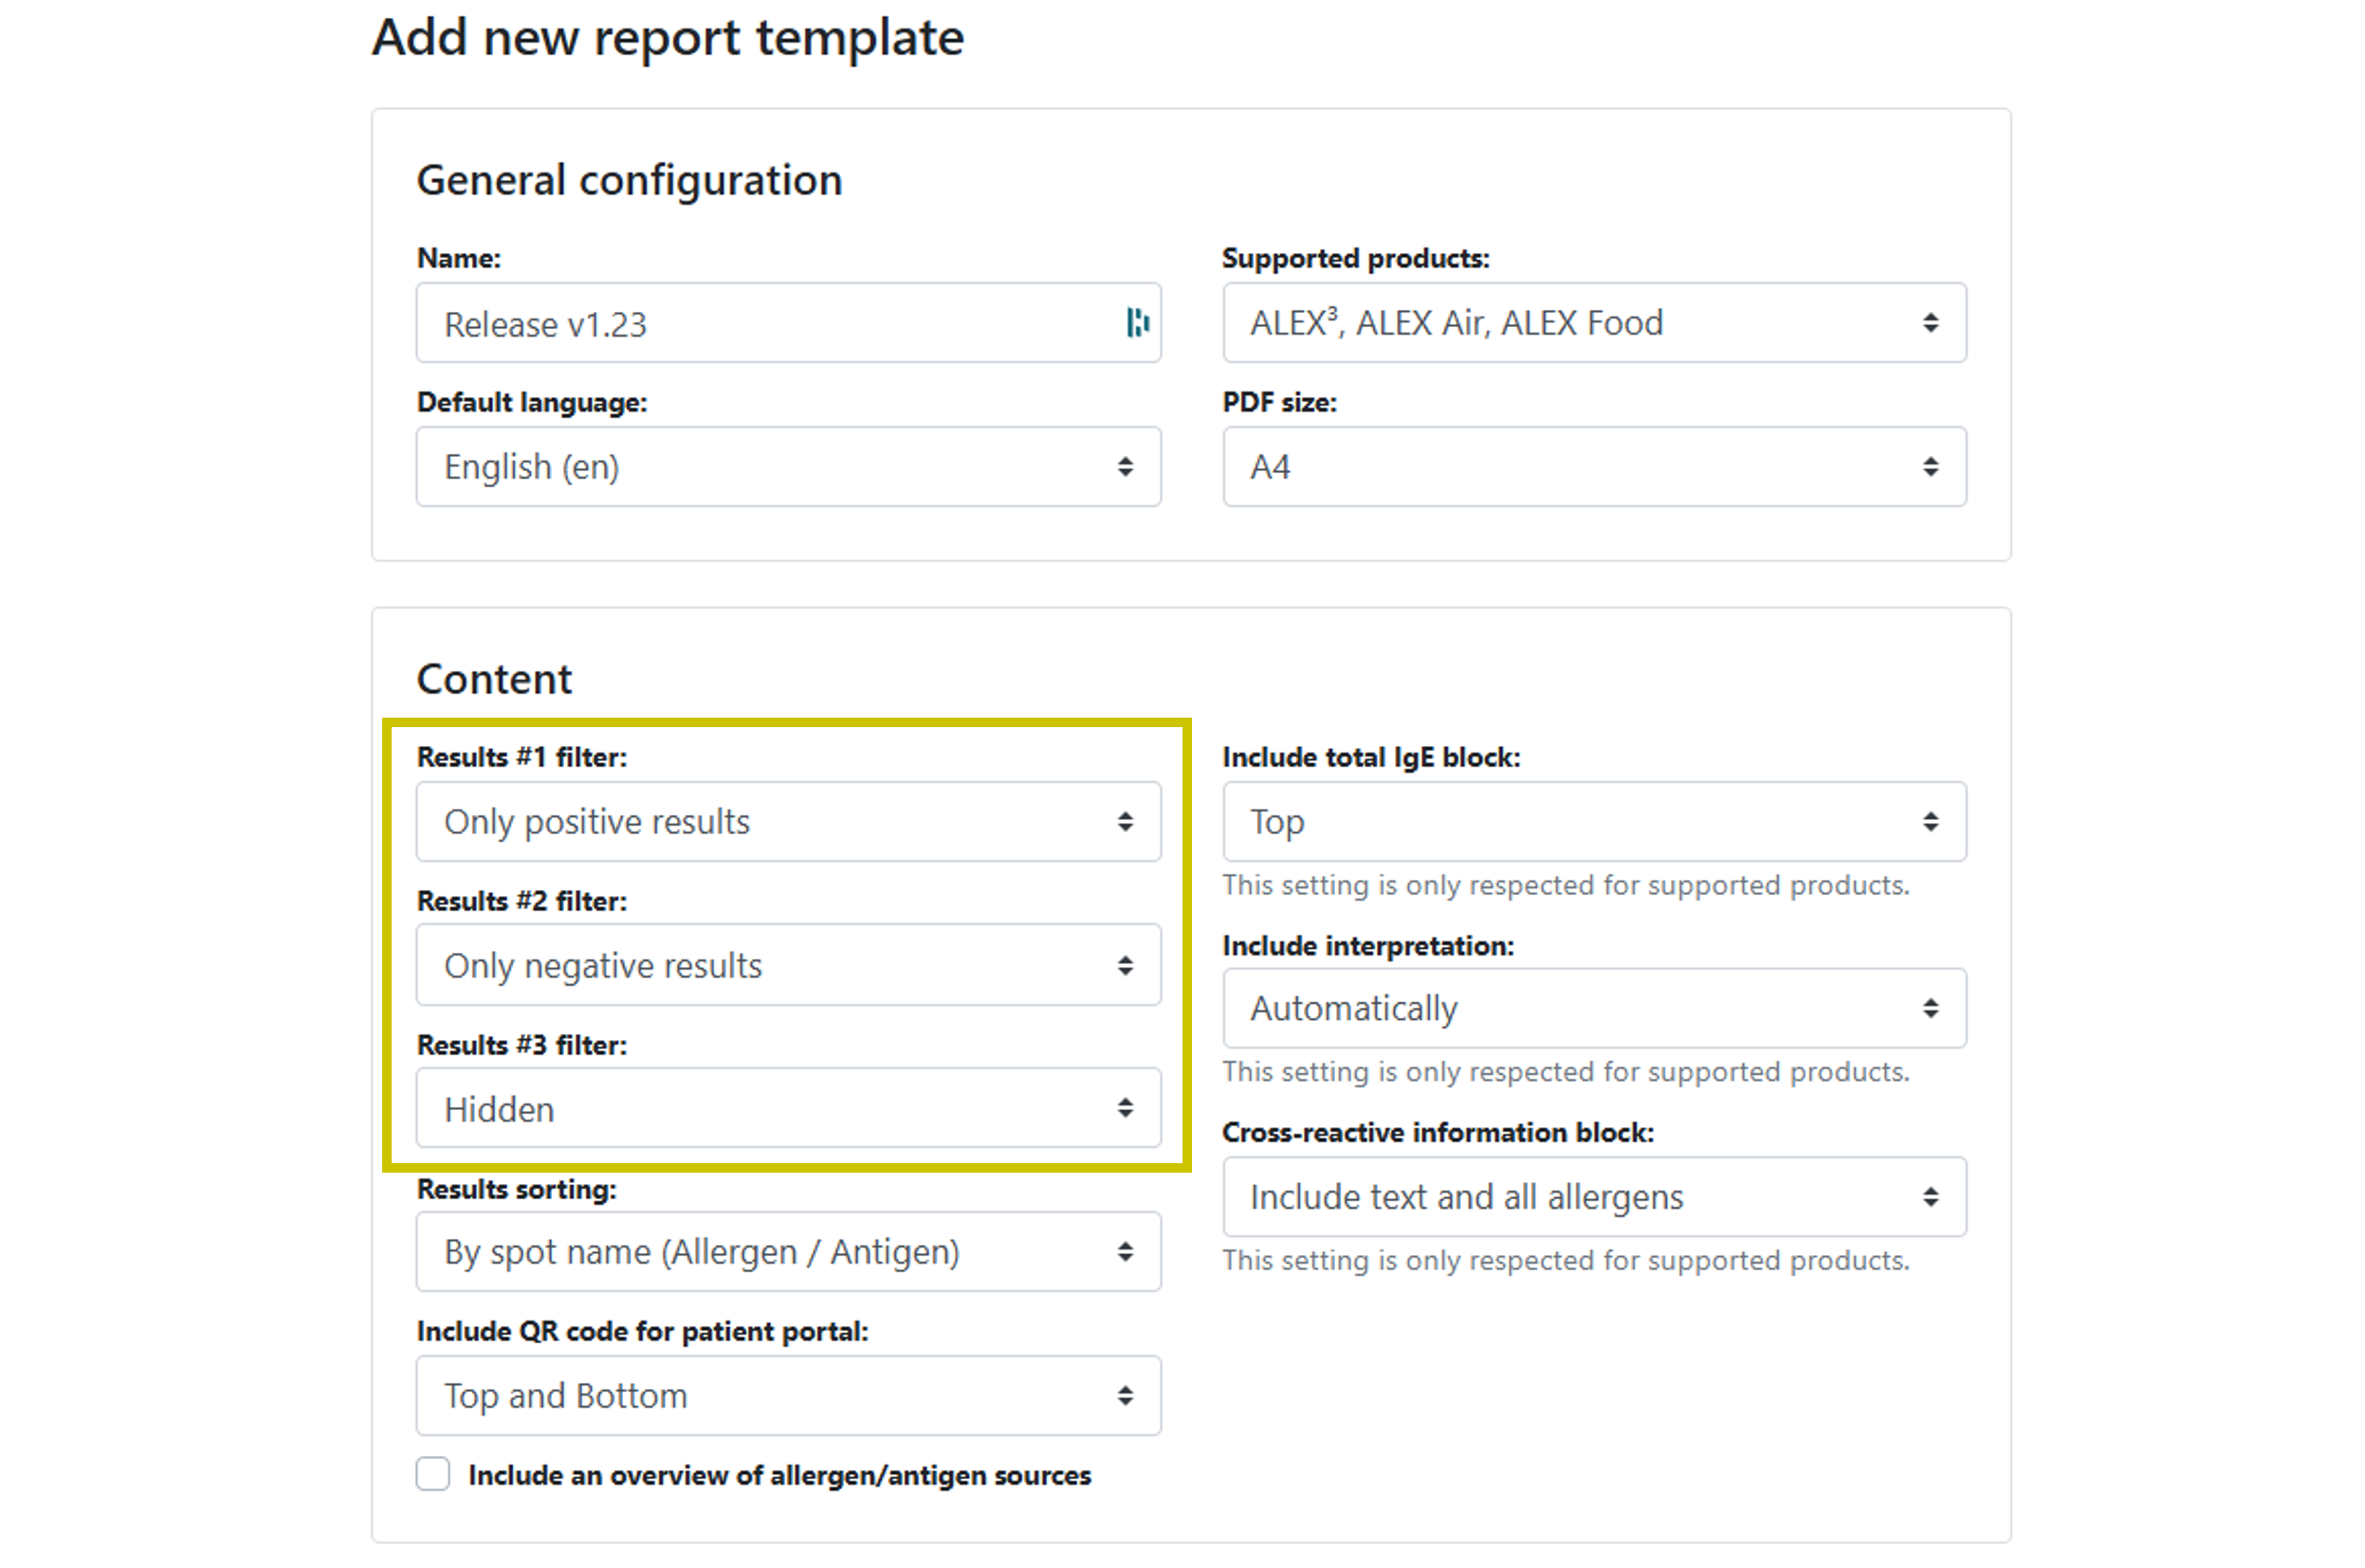
Available filters (per section)
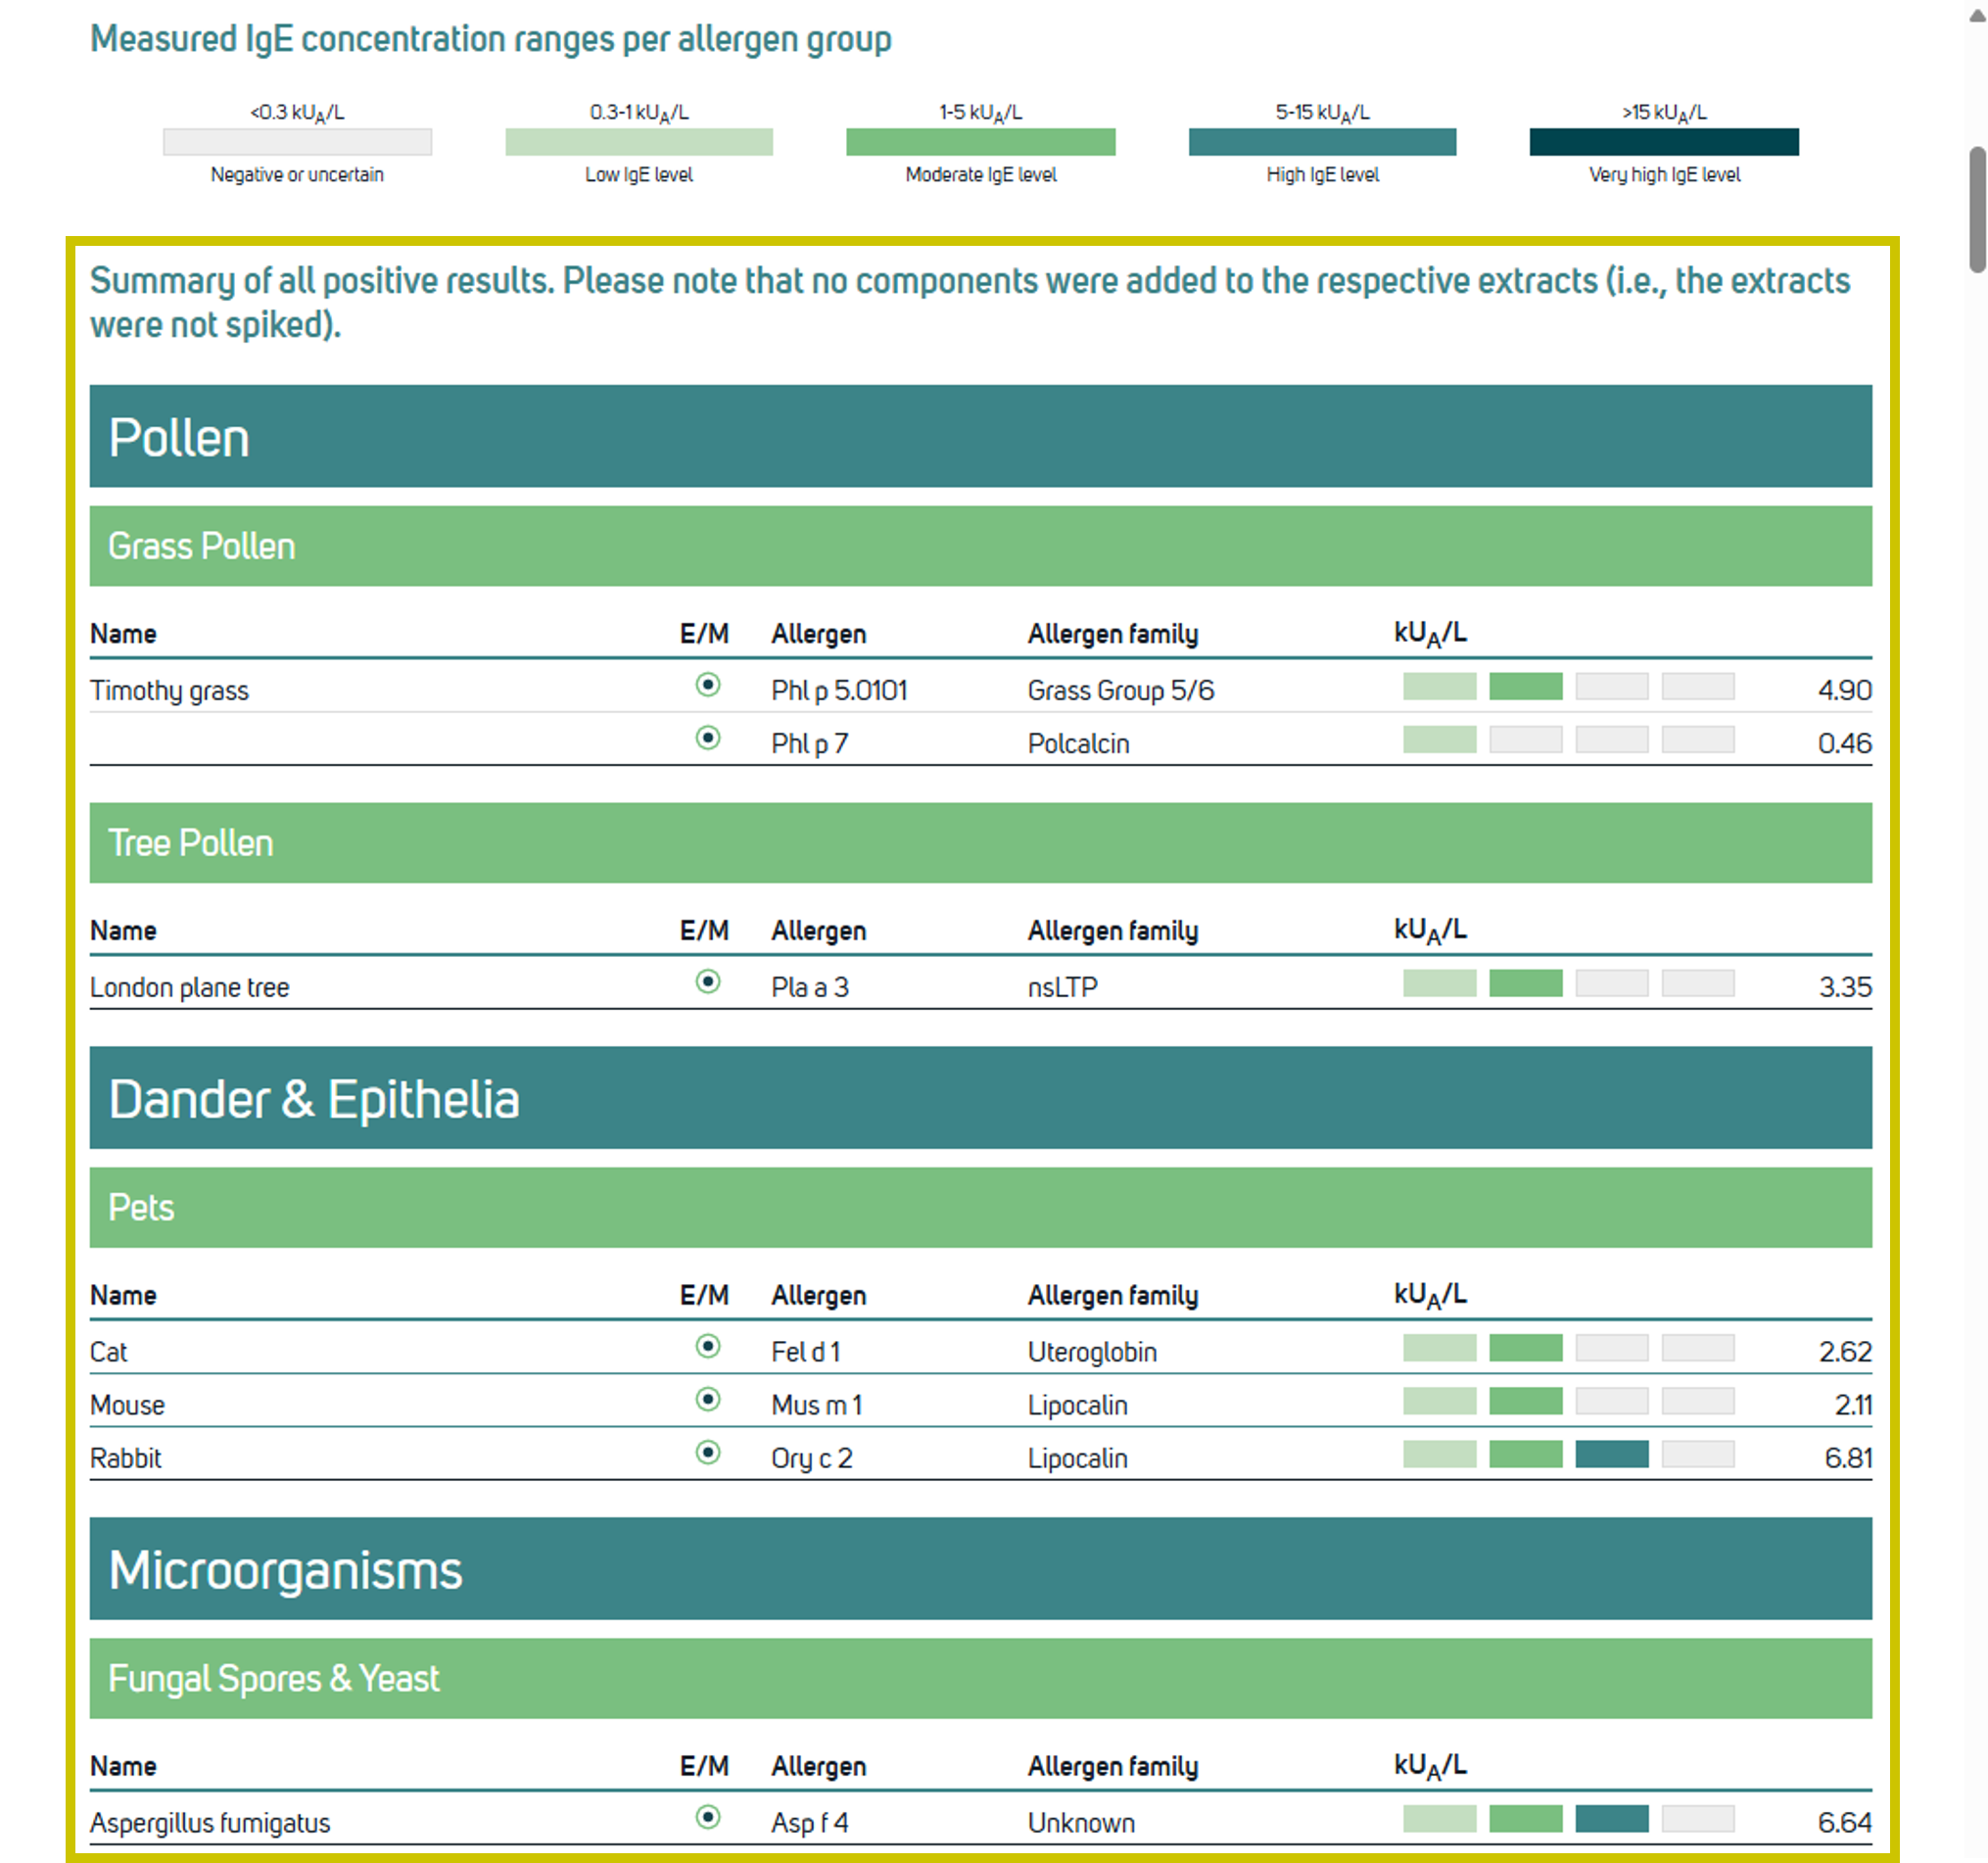
Ordering and combinations: The three sections can be arranged and combined as needed. For example, configure one section for “Only positive results” followed by a section for “Only negative results”.
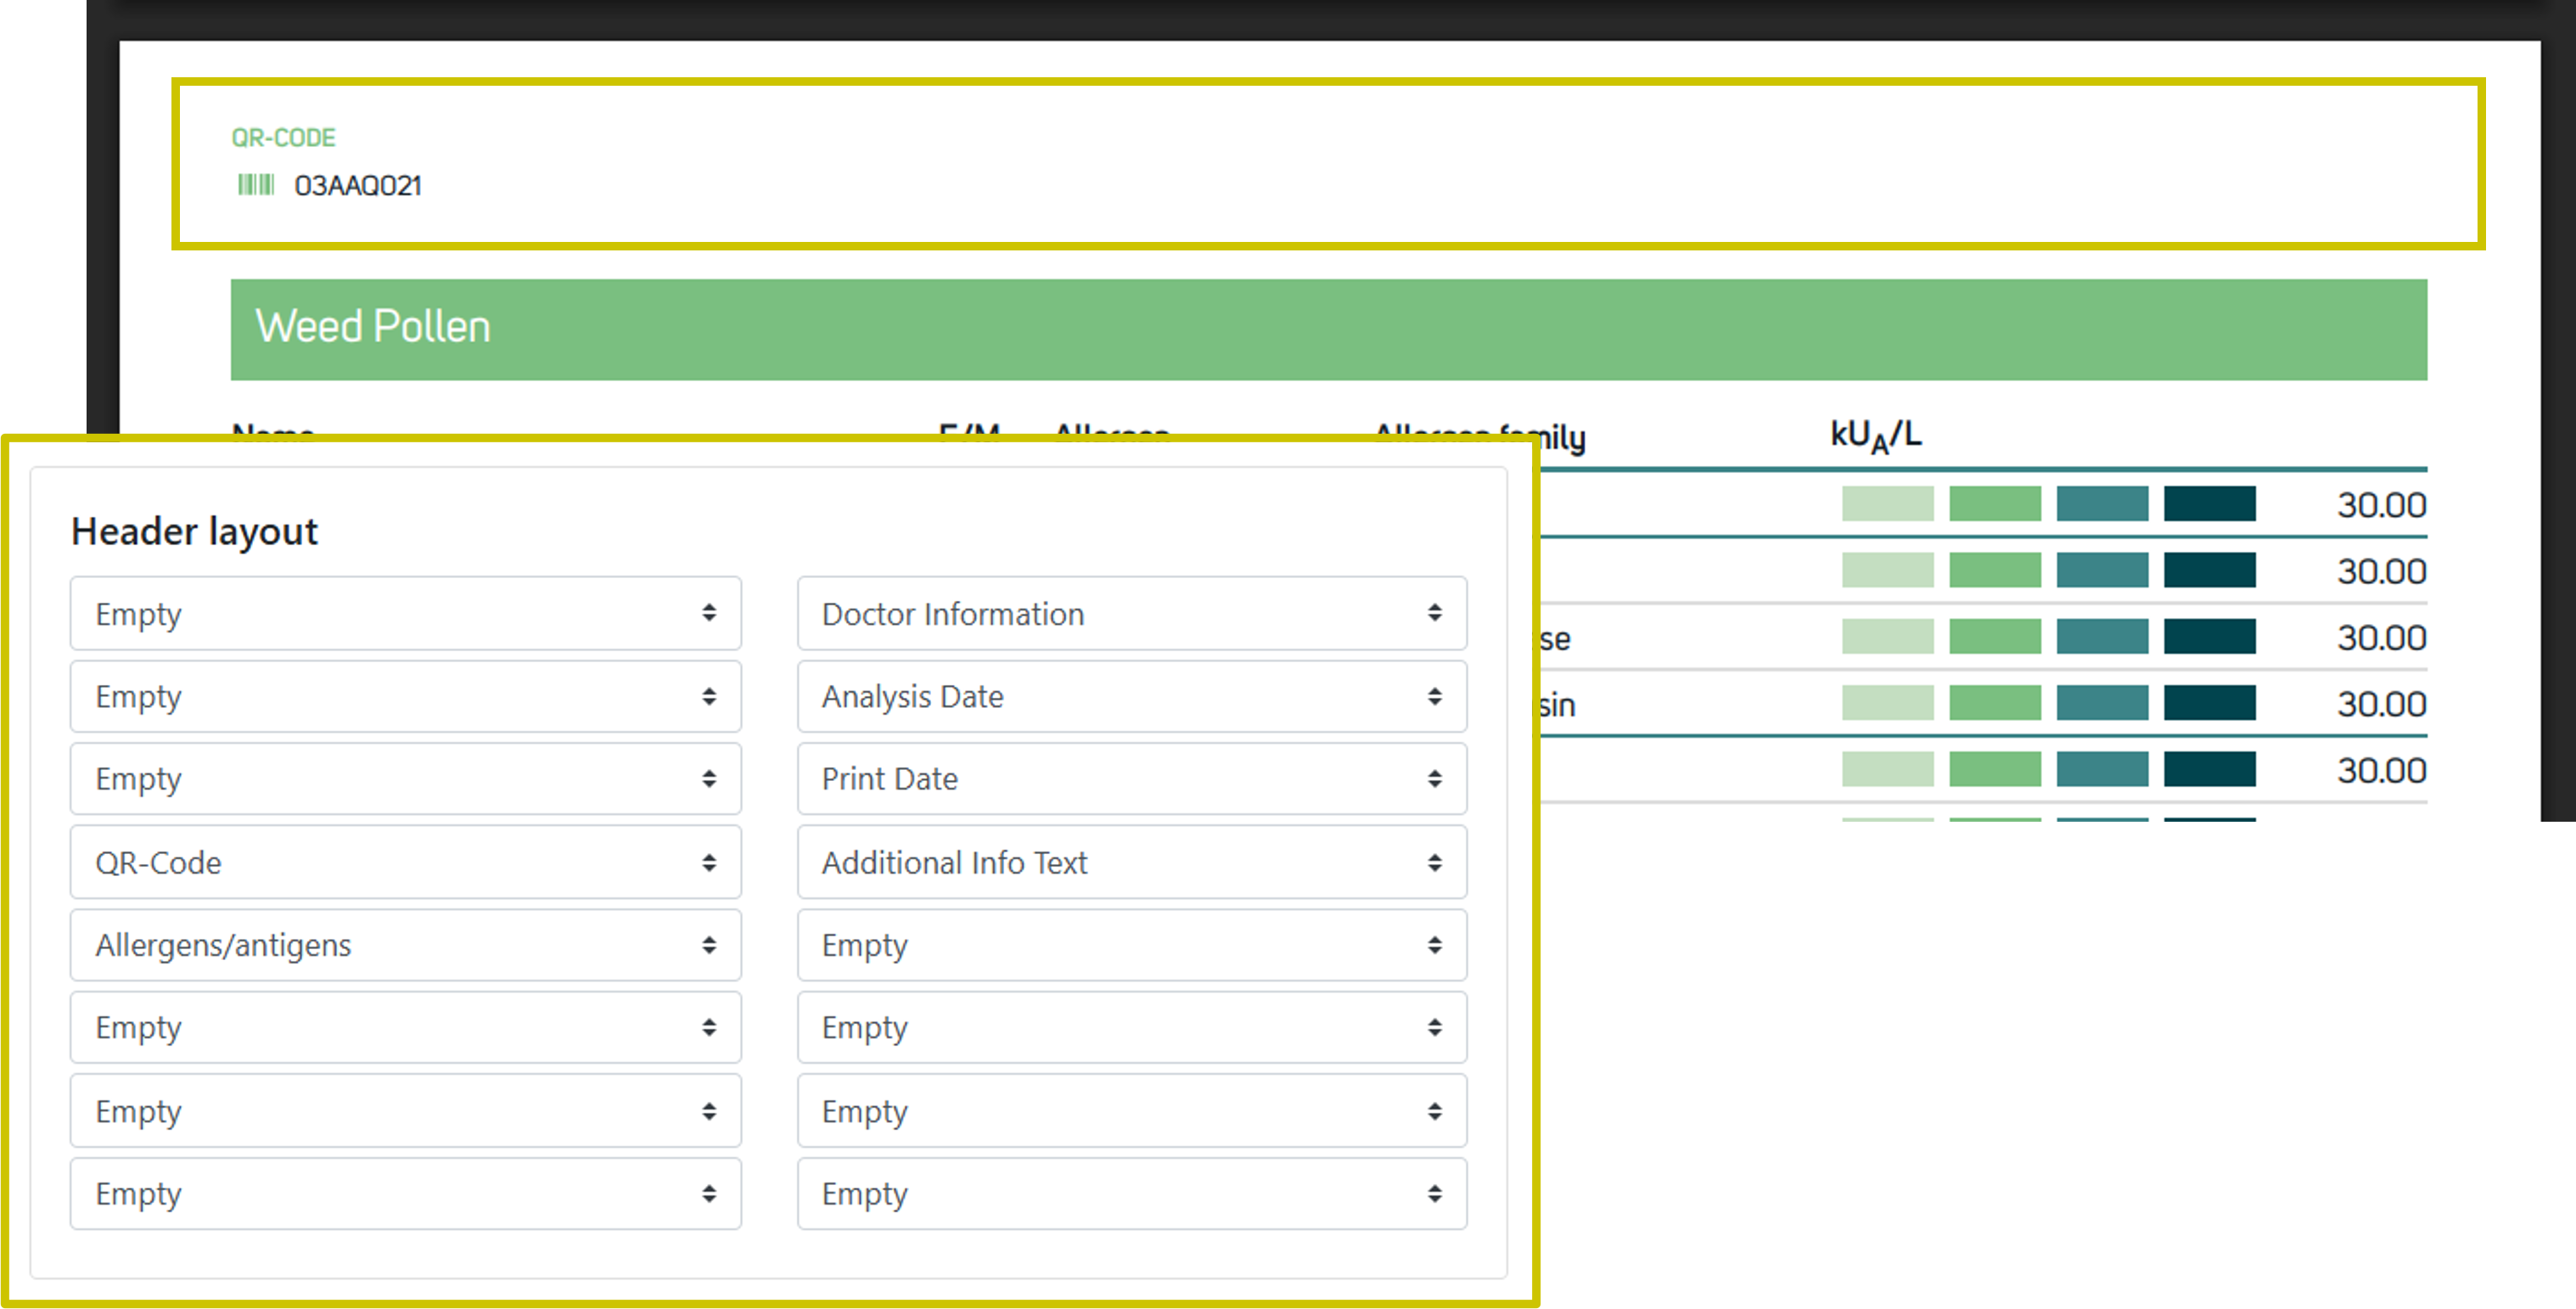
The report header now displays only the fields selected in Header Layout.
This selection applies to both the header on page 1 (as usual) and the header on pages 2+.
When “PATIENT CODE” and/or “PATIENT NAME” are not selected in Header Layout, those fields are omitted from the corresponding header(s) in the generated PDF.
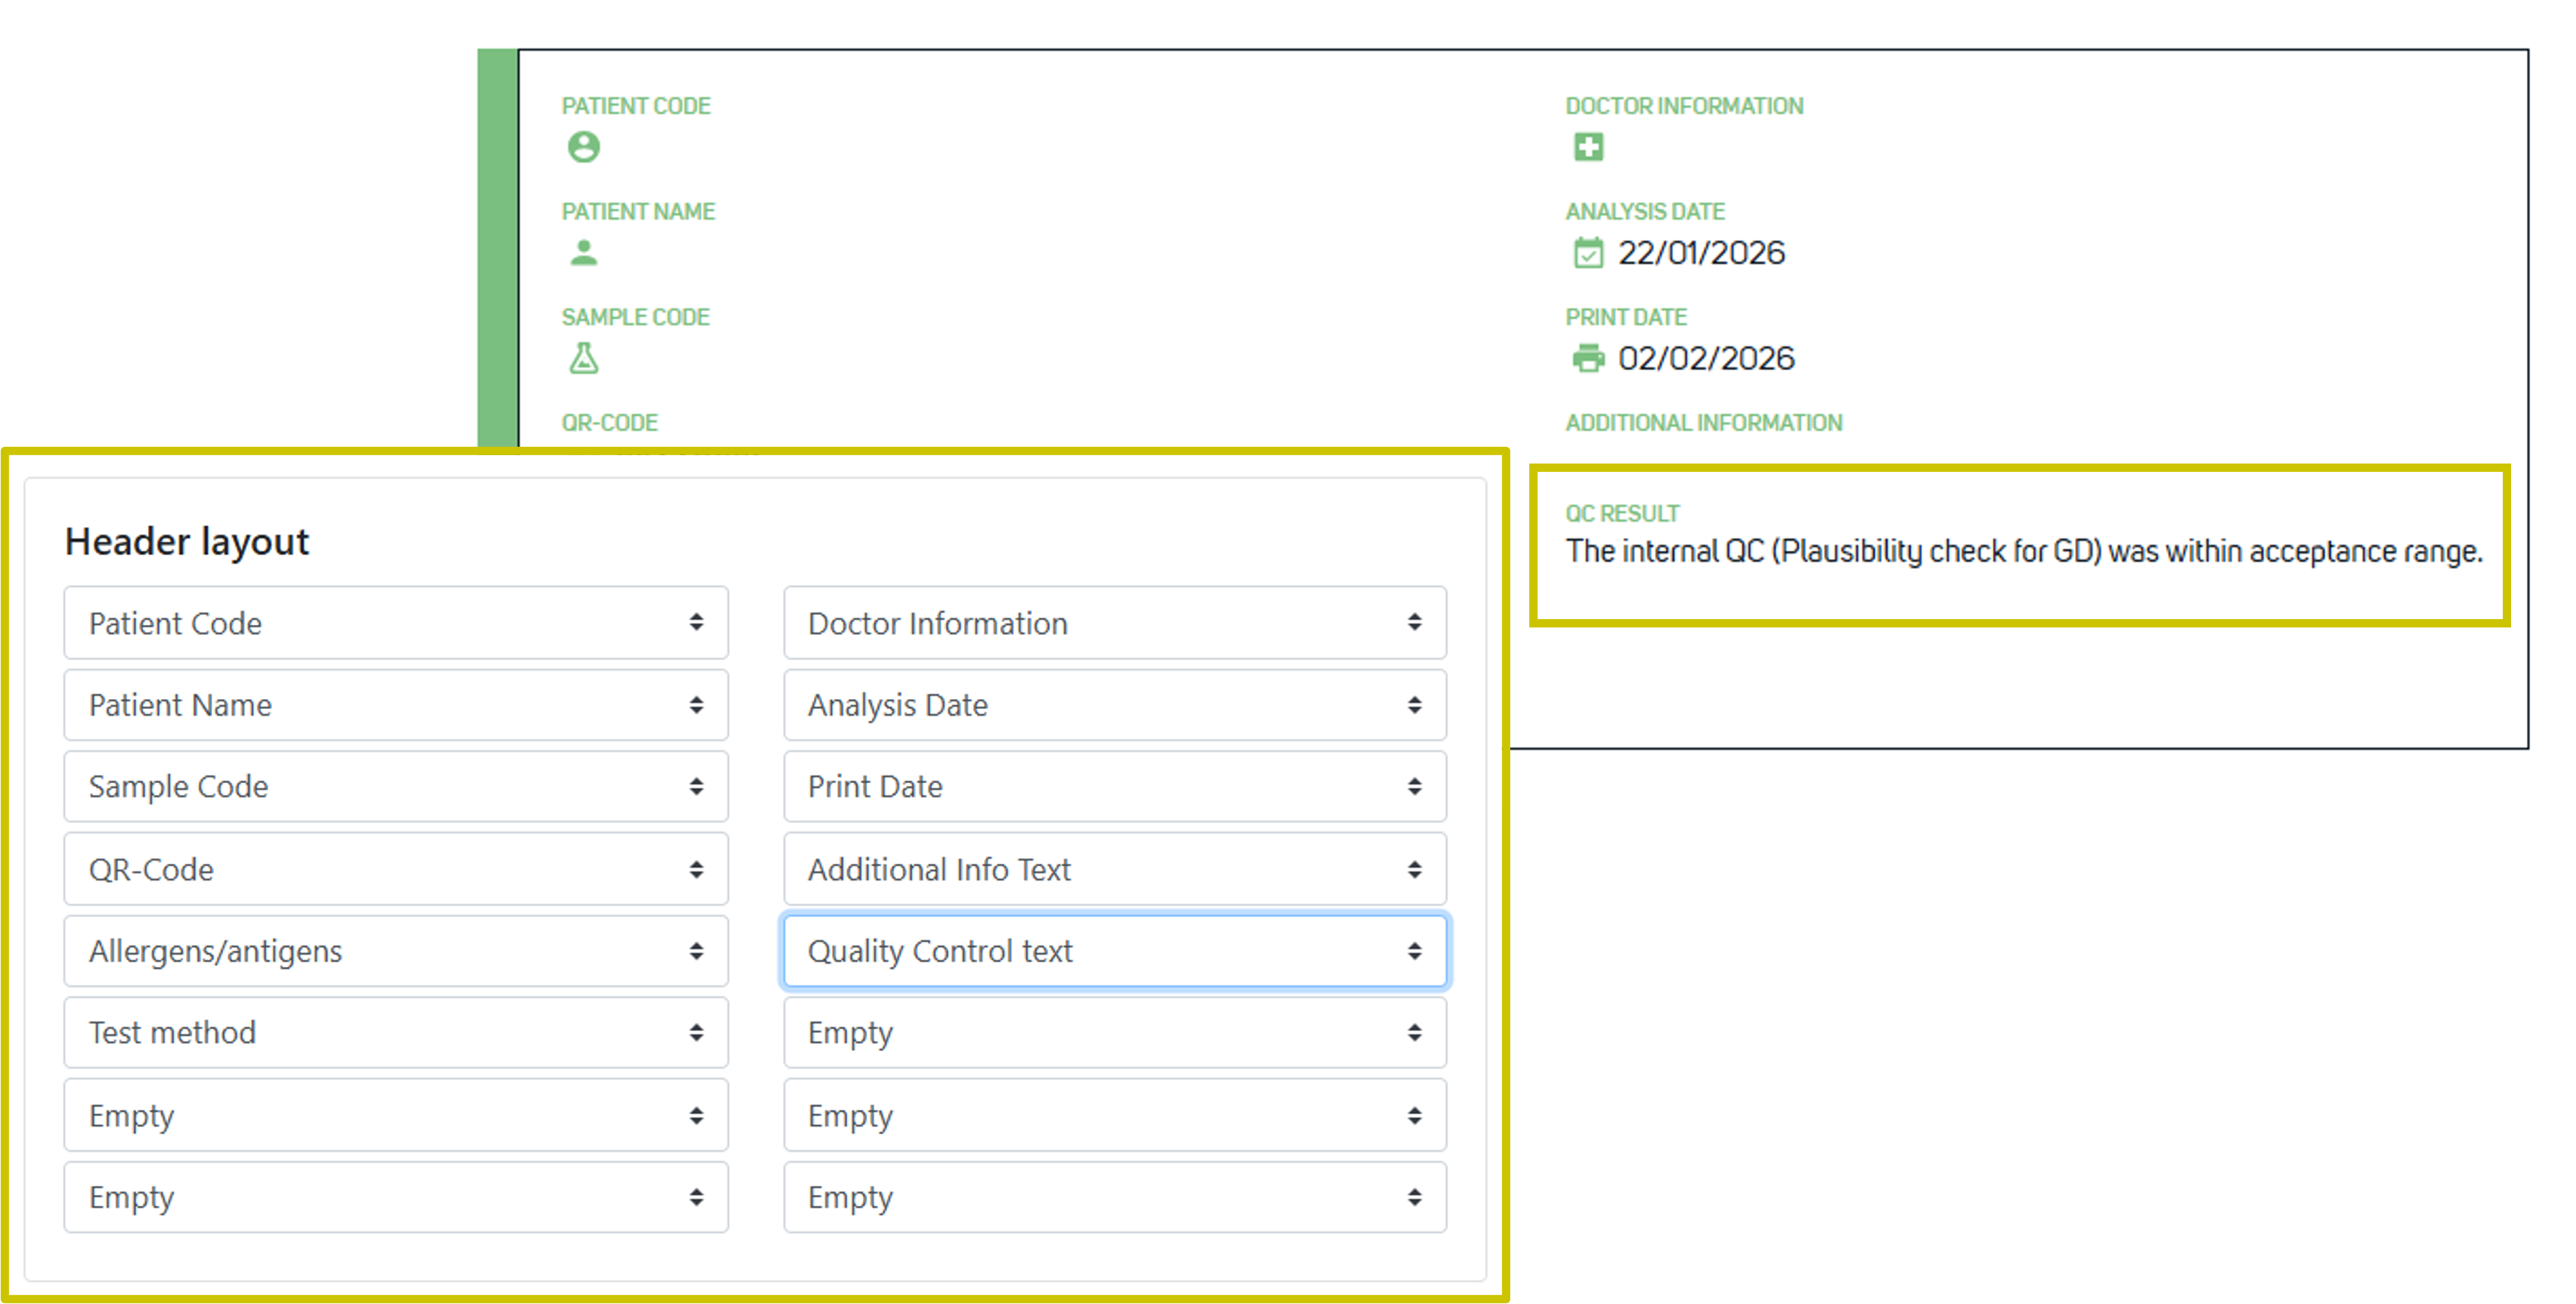
2025 report templates now support displaying the Automatic Quality Control result in the header of the first page.
Configuration: In the template configuration, select “Quality Control text” in Header Layout to show the QC result in the first page header of the generated PDF.
The existing cross-reactive information block in 2025 ALEX report templates now offers additional configuration options and updated explanatory text. The block appears below the results.
Configuration (template level): Choose one of the following options:

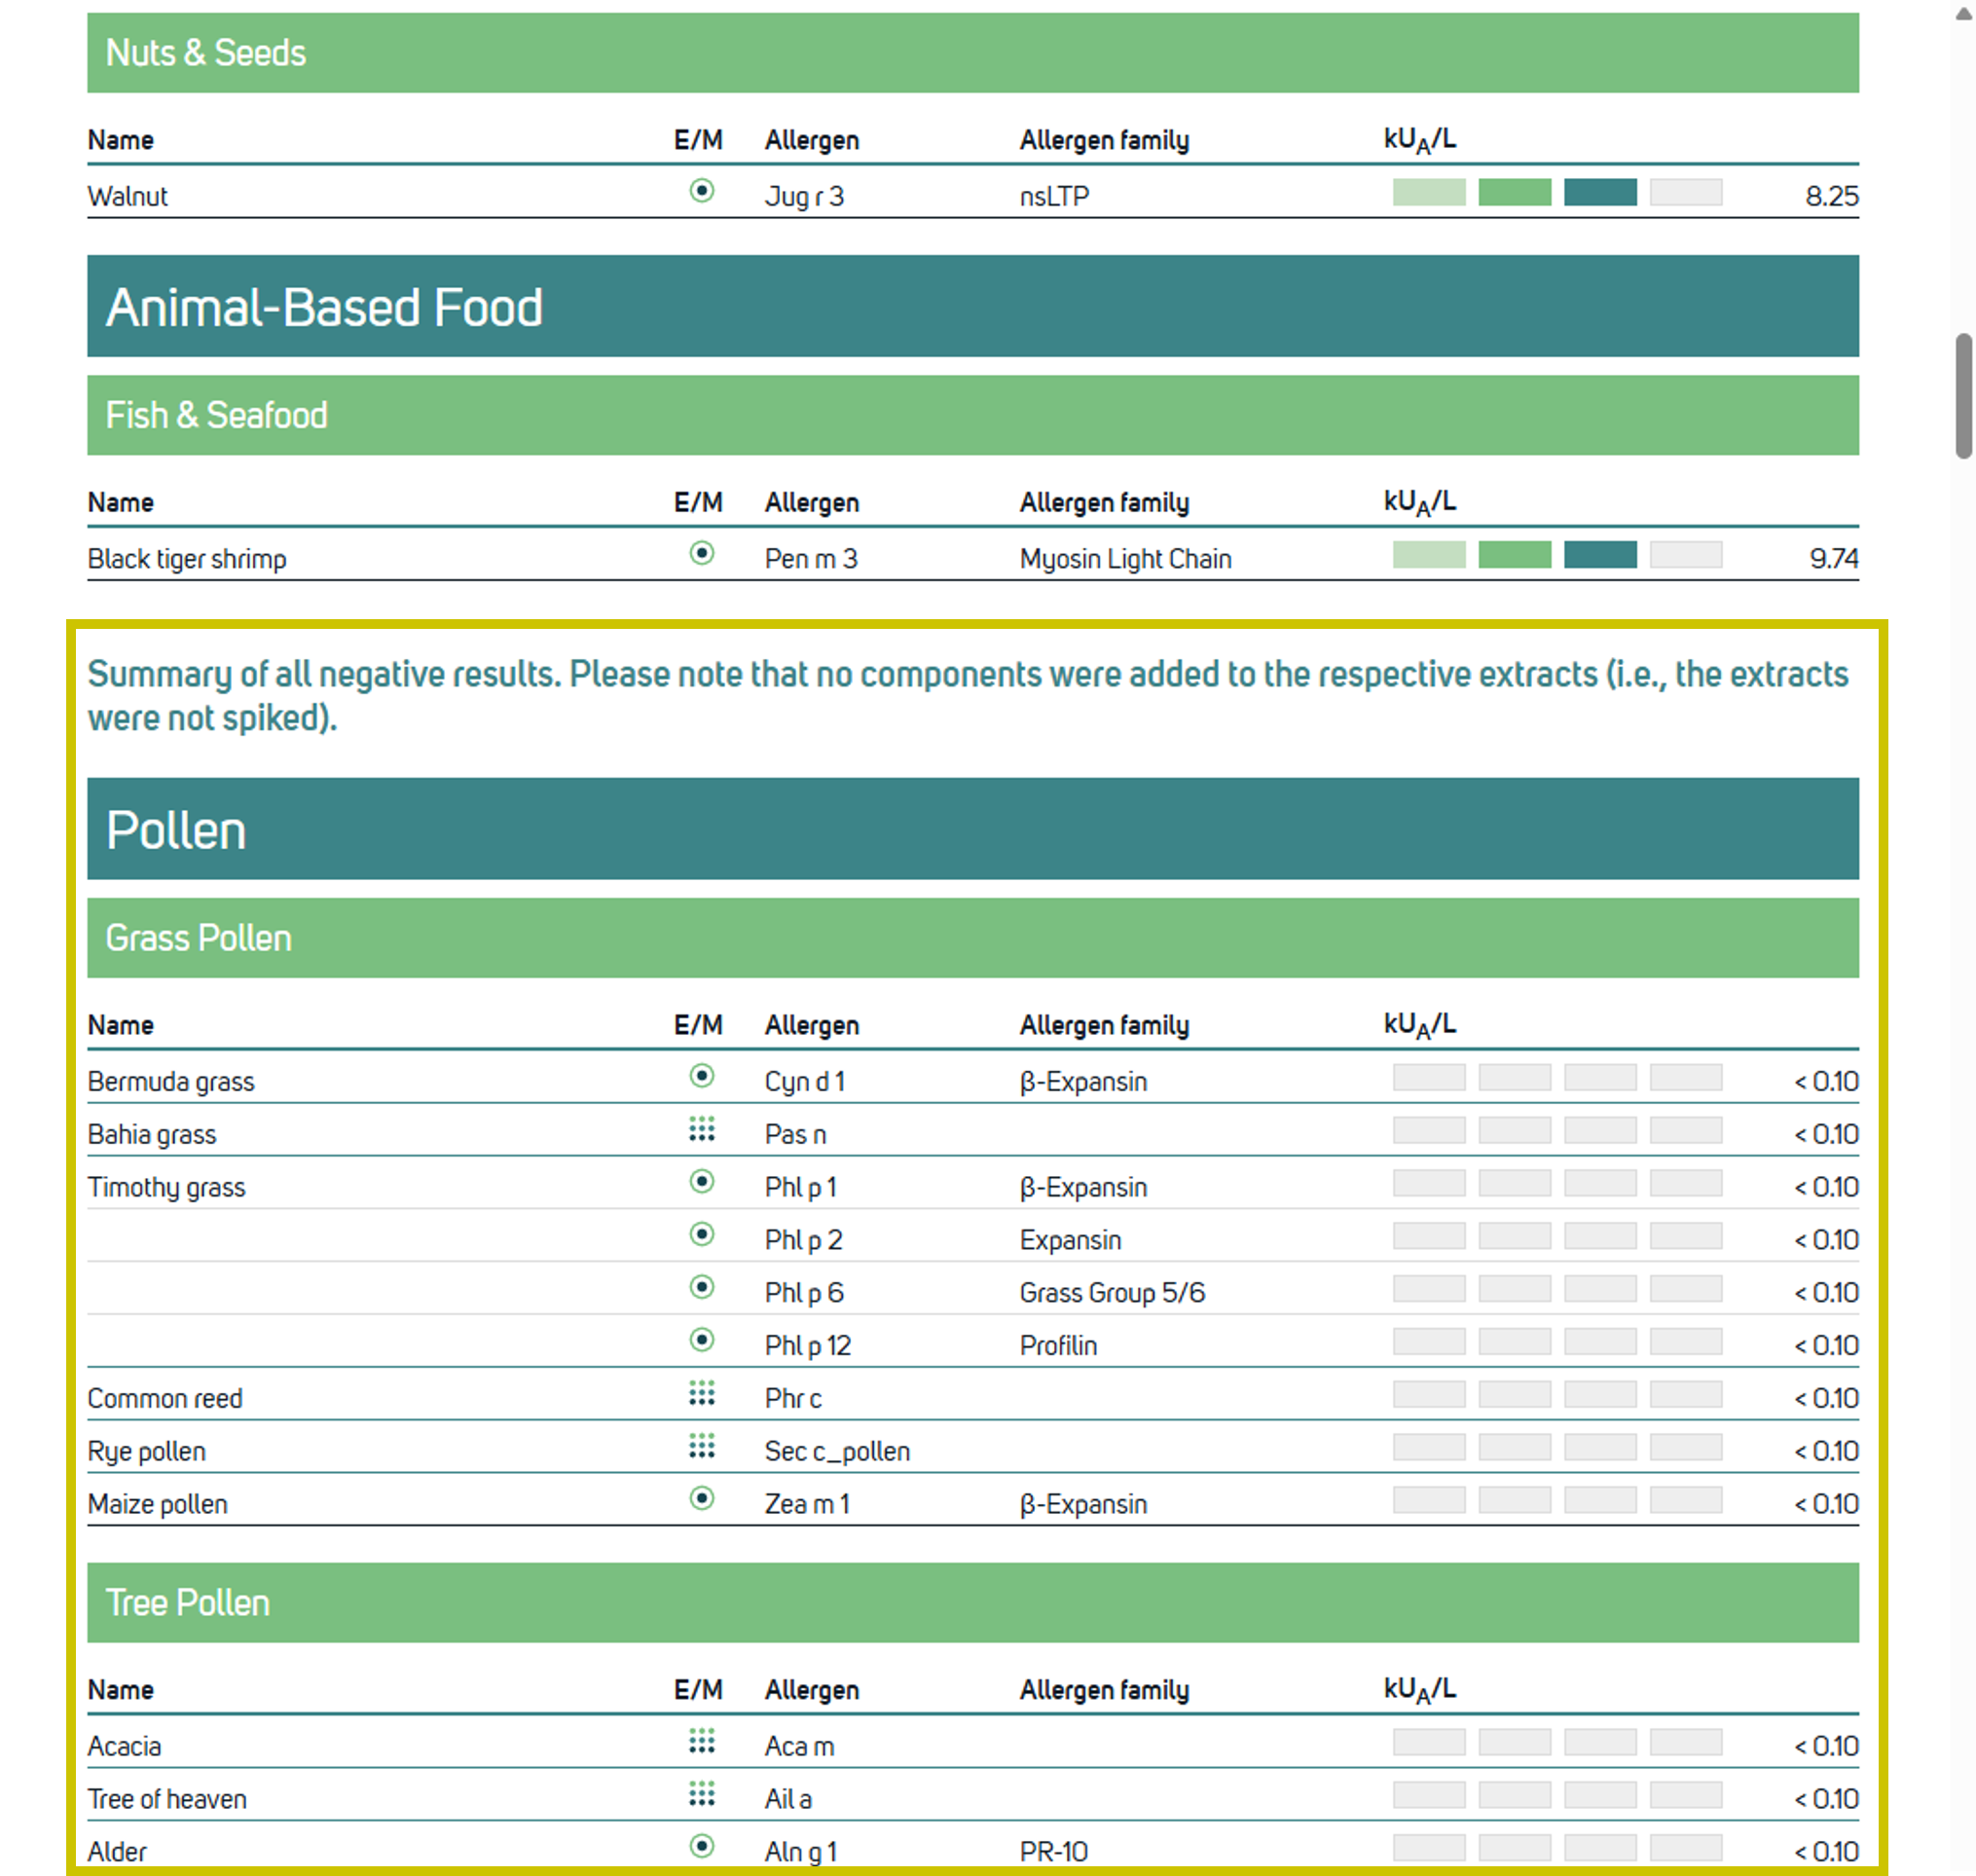
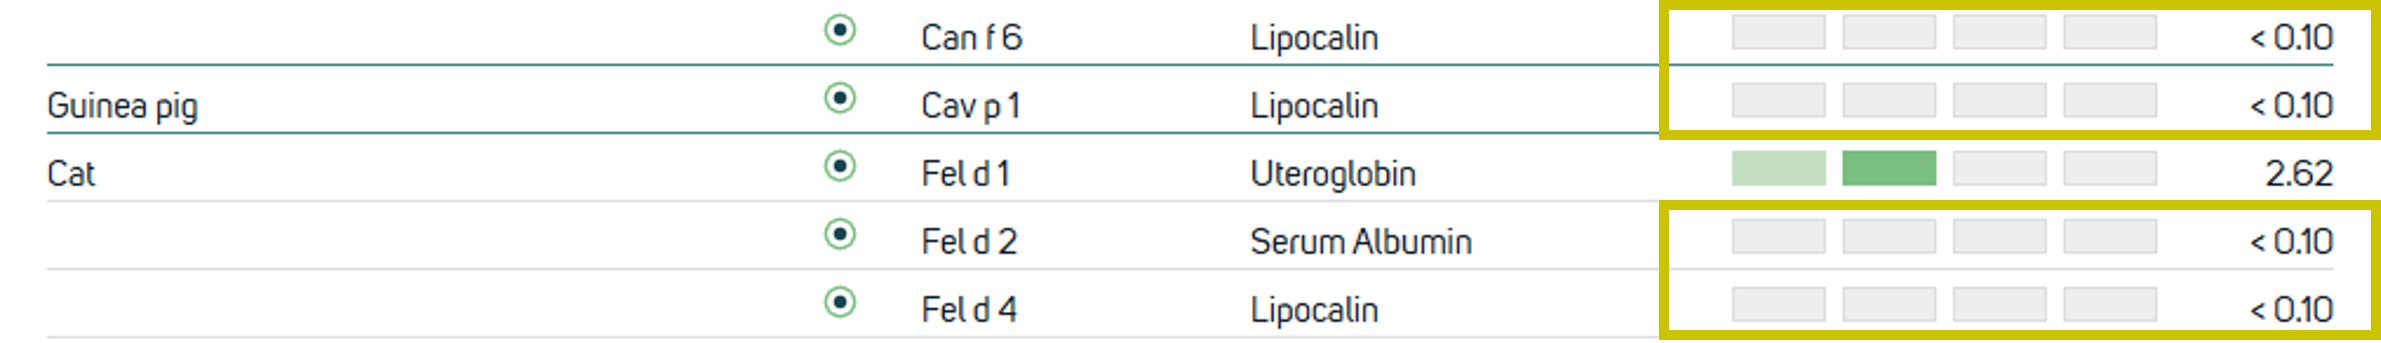
In 2025 reports, the label “Negative” has been replaced with the more precise “< 0.10”. Additionally, the text color for negative results has been changed to black to improve readability and to avoid issues on printed copies.
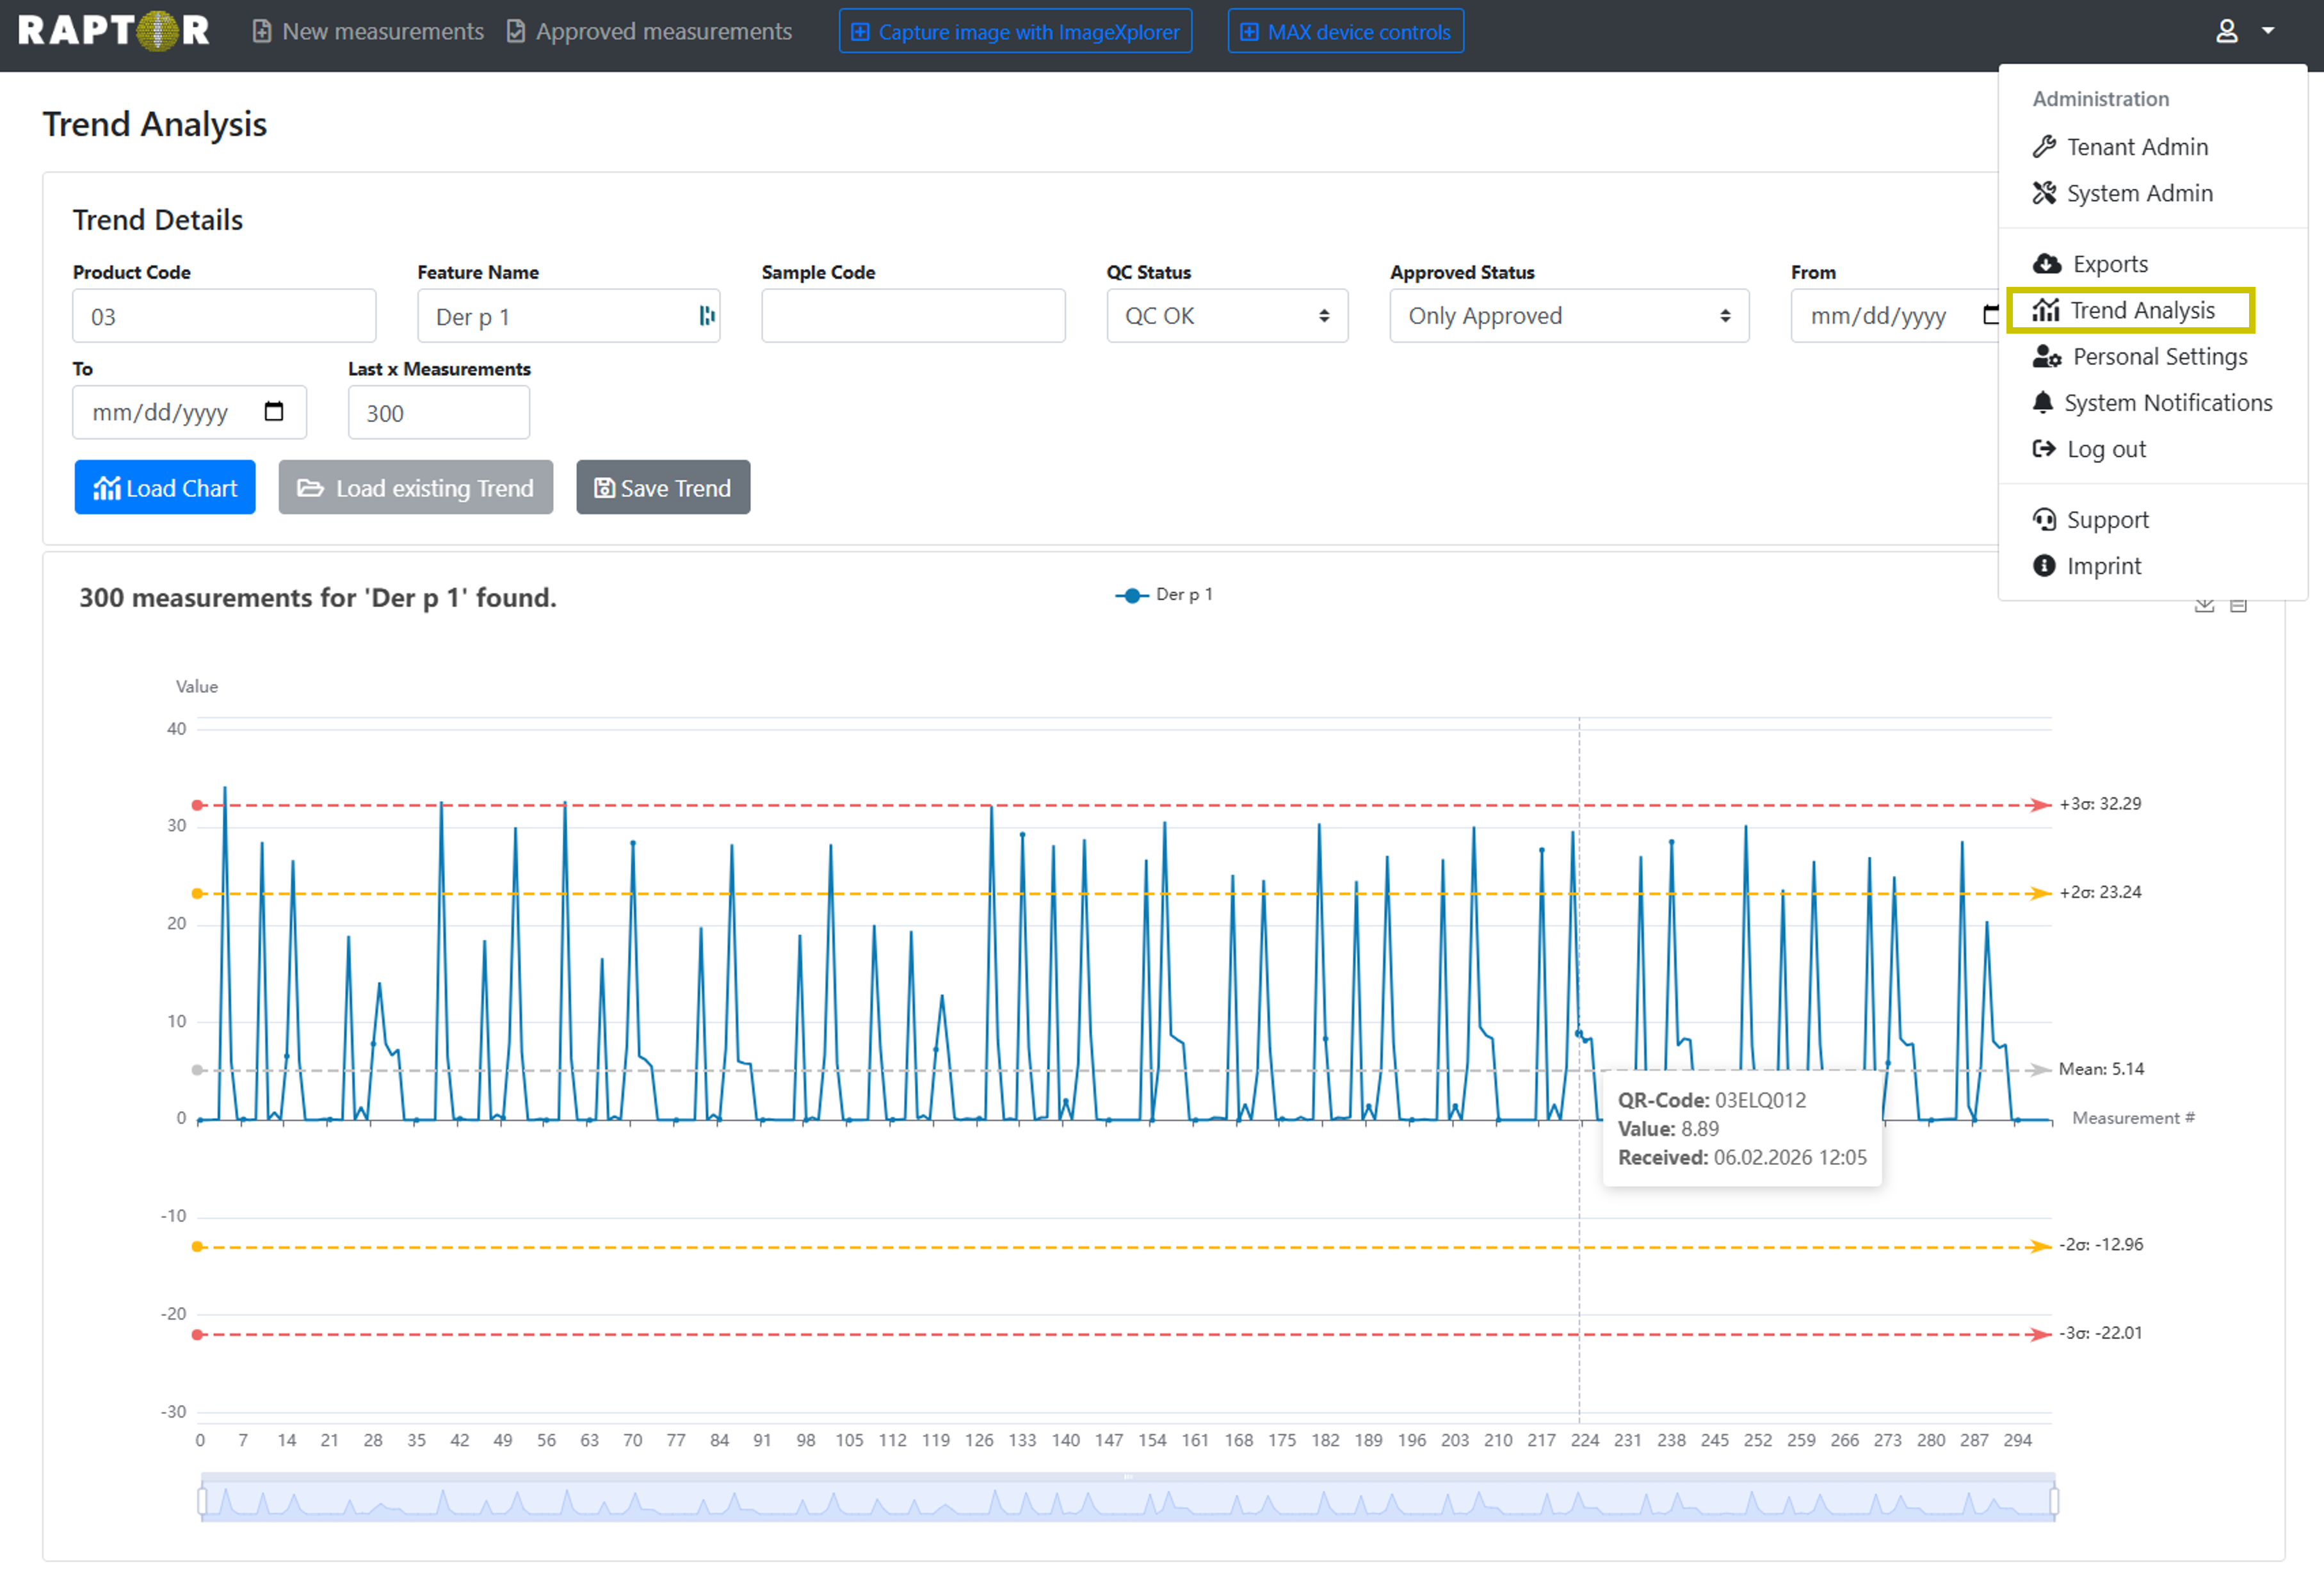
A new Trend Analysis feature enables tracking allergen stability throughout the product life cycle using internal quality control samples and visualises results in a Levey–Jennings chart, providing clearer insight into longterm performance.
Inputs and filtering
Chart interactions: Controls in the upper right of the chart allow downloading the chart as an image or viewing the underlying data as a table. Slider controls beneath the chart adjust the measurement range included in the graph. Using descriptive sample names is recommended to make subsequent filtering easier. To open the feature, select the menu icon (upper right) and choose “Trend Analysis".
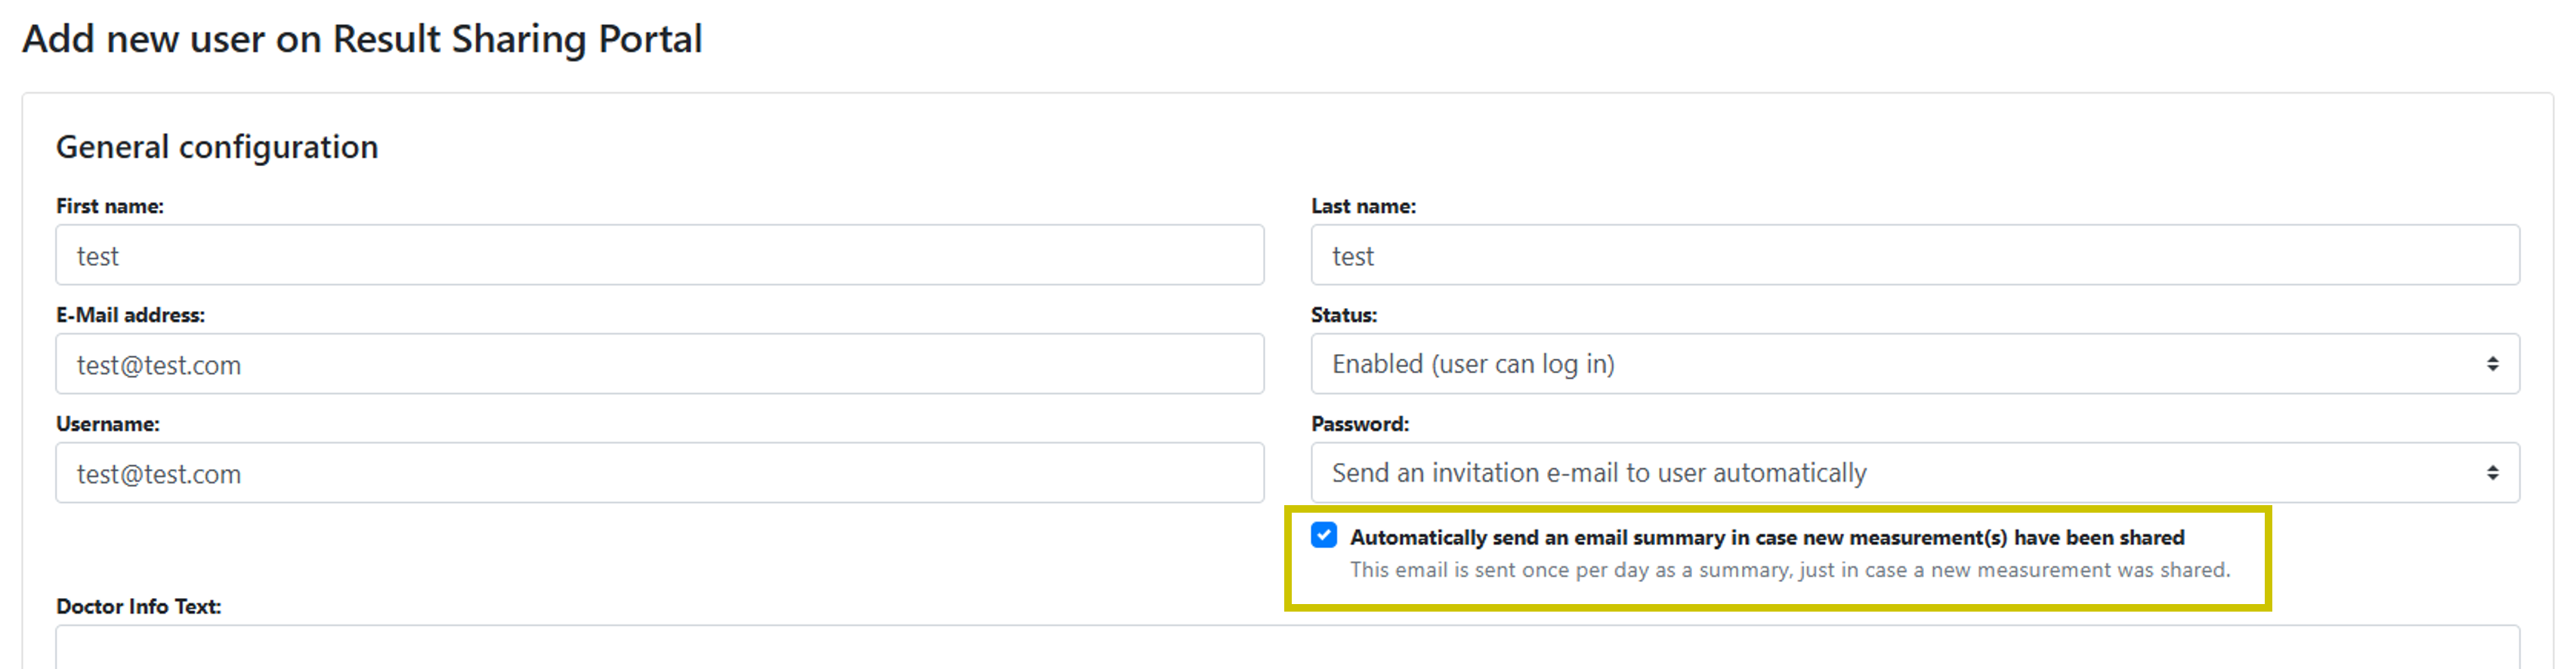
Sharing measurements with a Result Sharing Portal user now triggers a daily summary email that notifies the user about new shares.
Configuration: Open the Result Sharing Portal user's management page, create a new user or edit an existing user, then enable the checkbox “Automatically send an email summary in case new measurement(s) have been shared”.
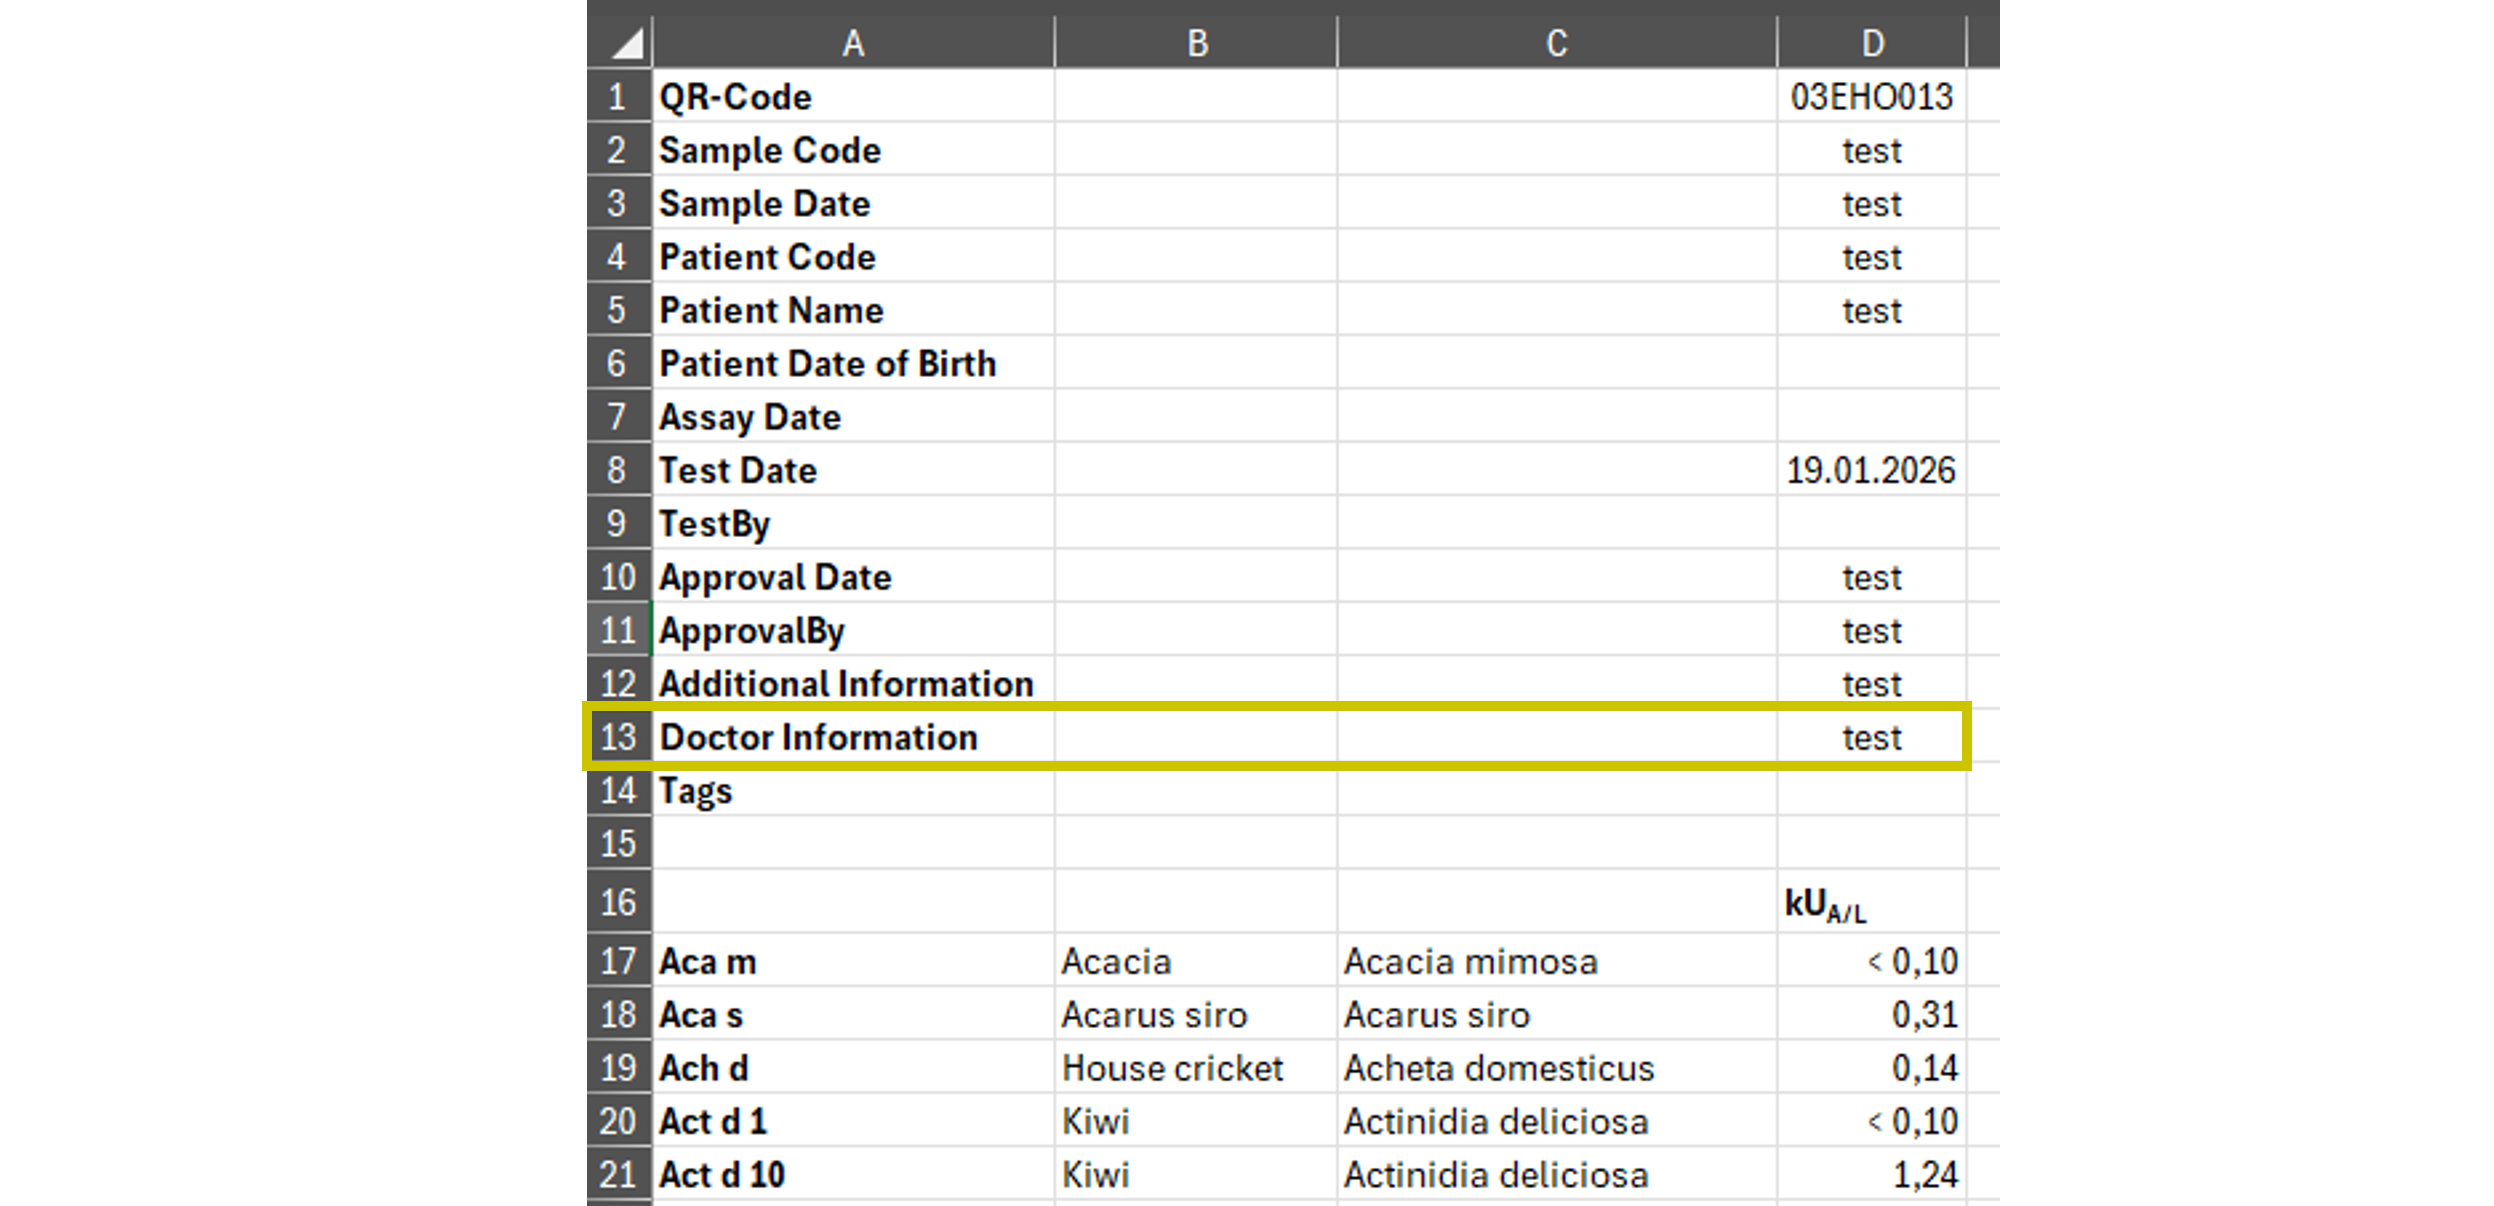
When exporting a measurement to Excel, the “Doctor Information” field is now added as a new row between “Additional Information” and “Tags”.
Note: Result rows will now begin at row 17.
The shift in row positions can affect automations that rely on fixed row numbers or static ranges.
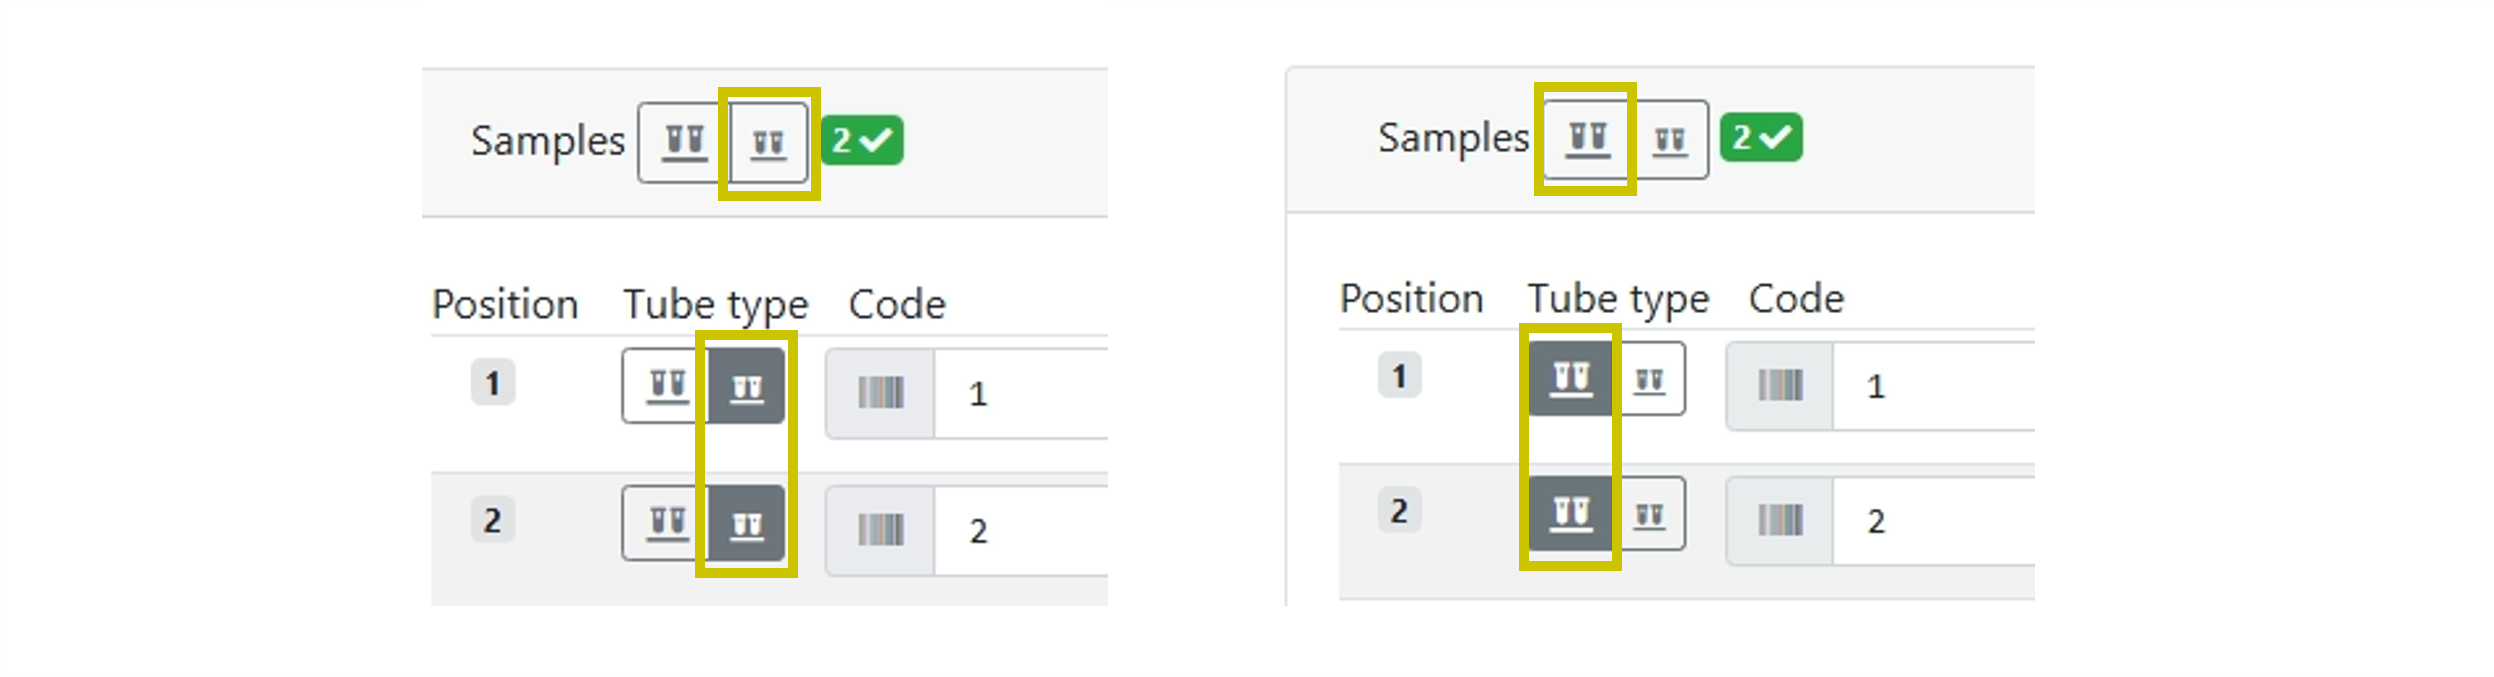
During run setup on MAX devices, tube type selection is now clearer and less error-prone.
What changed
Users can explicitly select the intended tube type without ambiguity, supporting more reliable run setup and inventory management.
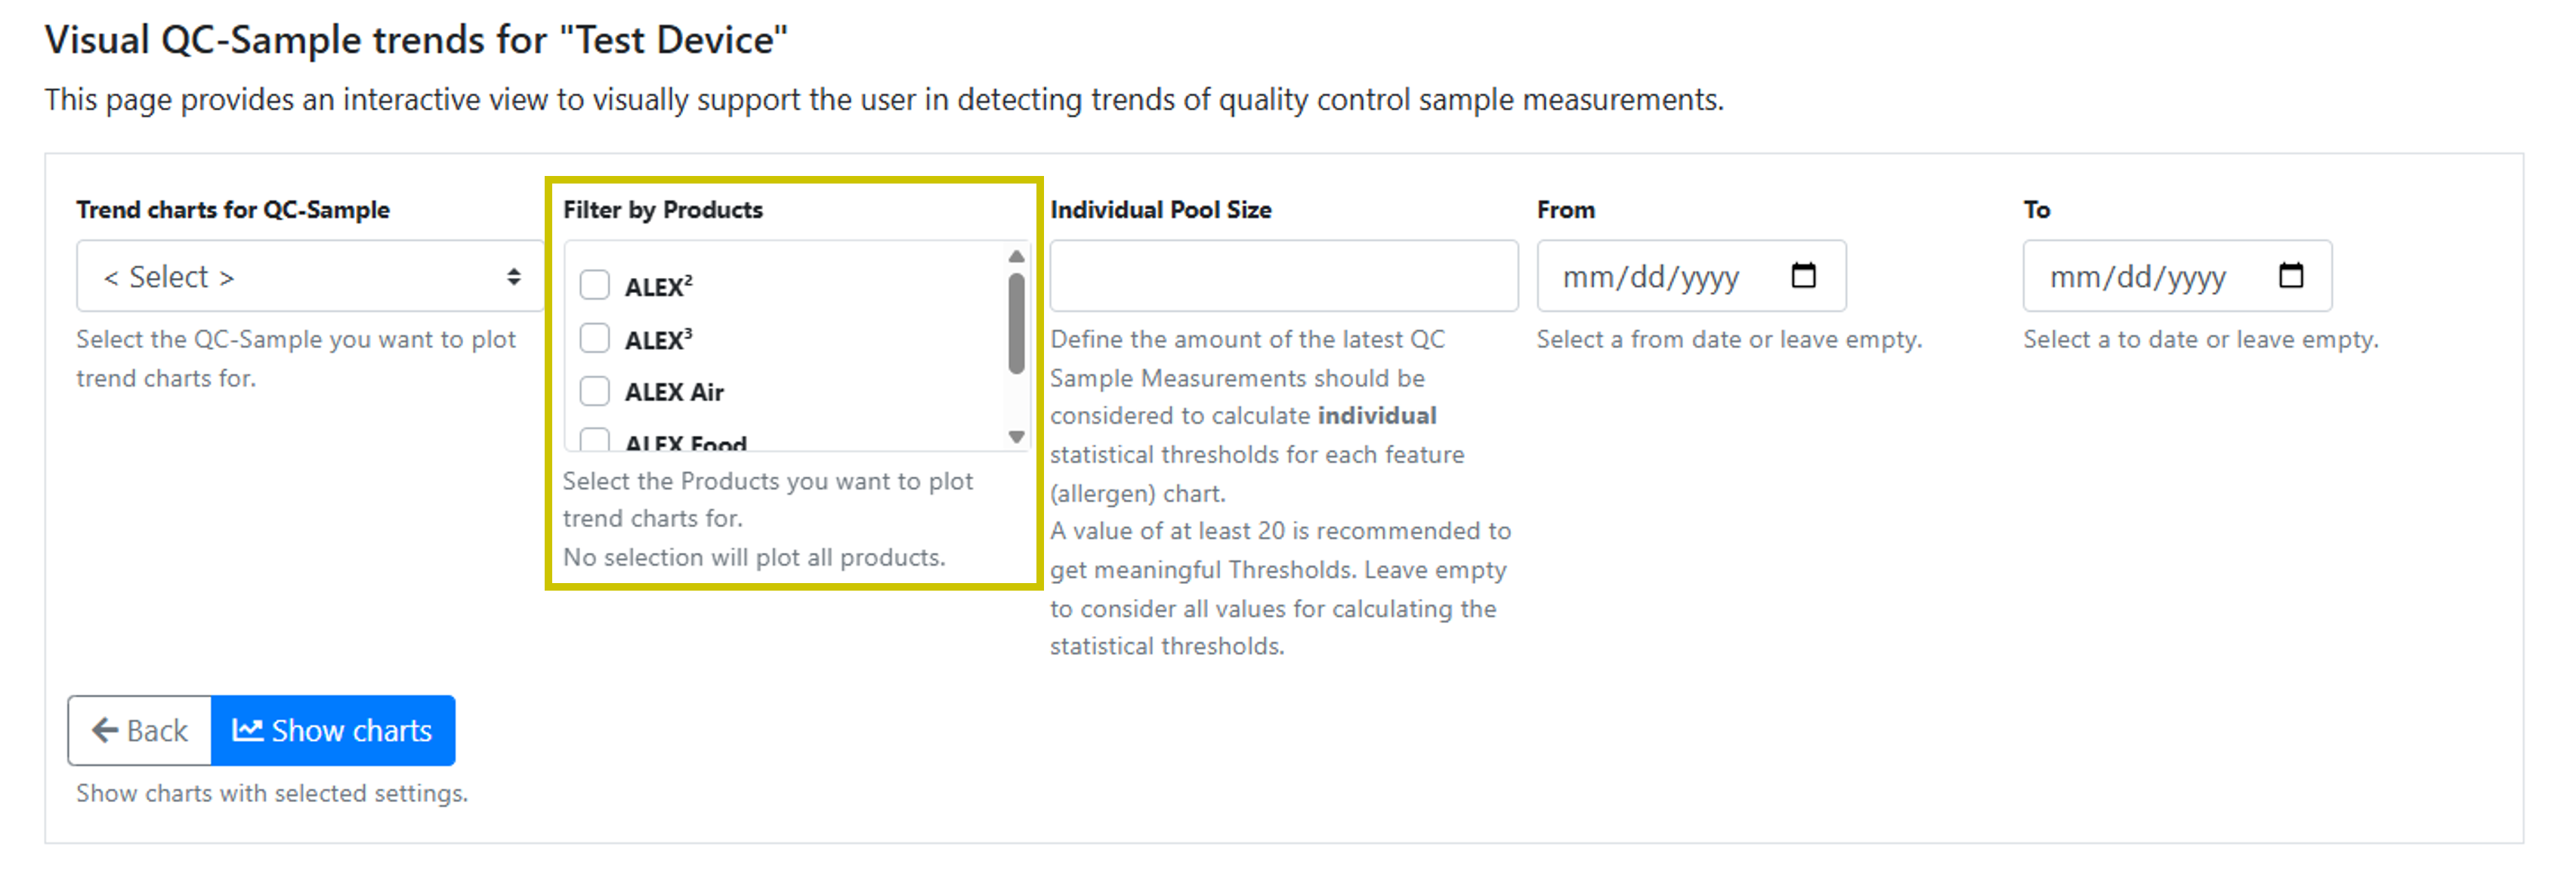
A product filter has been added to QC Charts (Trend View), allowing visual QC sample trends to be limited to a specific product for more focused analysis.